There’s one thing the field of data science doesn’t lack in the last couple of months - innovation. Large language models (LLMs) such as ChatGPT have revolutionized the field, and most existing data science libraries for Python are still catching up.
That’s not the case for Pandas. Mito’s new AI feature combines already automated Pandas code writing with ChatGPT’s extensive knowledge. All you have to do is describe data transformations in plain English, and Mito AI will take care of the rest.
Today you’ll learn what Mito AI is, how to install it, and exactly how well it works for automated Pandas code generation through prompts.
Let’s dive in!

Table of contents:
What Exactly is Mito AI and How Does it Work with Pandas?
The main premise behind Mito is simple - you edit your data as a spreadsheet, and it automatically generates Python Pandas code for everything you’ve done. I’ve written about it on two occasions, so make sure to read these if you’re interested in non AI aspect of the library:
- Introducing Mito — How To Generate Pandas Code While Editing a Spreadsheet
- Data Analysis and Visualization Just Got Better — Mito Adds 5 Features You Should Try
When it comes to the newest feature - Mito AI - the idea is to simplify the data analysis process even further, and to make breaking into data analytics easier for beginners.
You can think of Mito AI as ChatGPT for Pandas DataFrames. You provide the task, Mito communicates with a GPT model through the OpenAI API, gets the response for your prompt, and applies the result directly to your data.
Probably the best part of using a GPT model for Pandas is that the model has context about your data and what you’re trying to do. This means you can ask a question and then reiterate on it later, for example in a couple of prompts.
Another well-implemented aspect of Mito AI is pricing. Every request to the OpenAI API costs money, but the team behind Mito is generously allowing you to make 100 free requests. I’ll talk about pricing later - just wanted to get this concern out of the way.
And now, let’s actually start using Mito.
Getting Started with Mito and Mito AI
Installing Mito is somewhat different from installing other Python packages. You’re recommended to use a virtual environment, from which you’ll then install the Mito installer that’s responsible for installing Mito.
It’s an extra step, but I’ll walk you through everything.
Installing Mito With Pip and Anaconda
The first step is to create a new virtual environment. This is an optional step, but recommended since you don’t want to cause any dependency mismatch.
The following shell command creates an environment called mitoenv based on Python 3.10. The optional -y flag accepts the installation of all required dependencies:
conda create --name mitoenv python=3.10 -y
If you’re using venv to manage Python virtual environments, run this command instead:
python3 -m venv mitoenv
Anyhow, here’s what you’ll see in the Terminal:
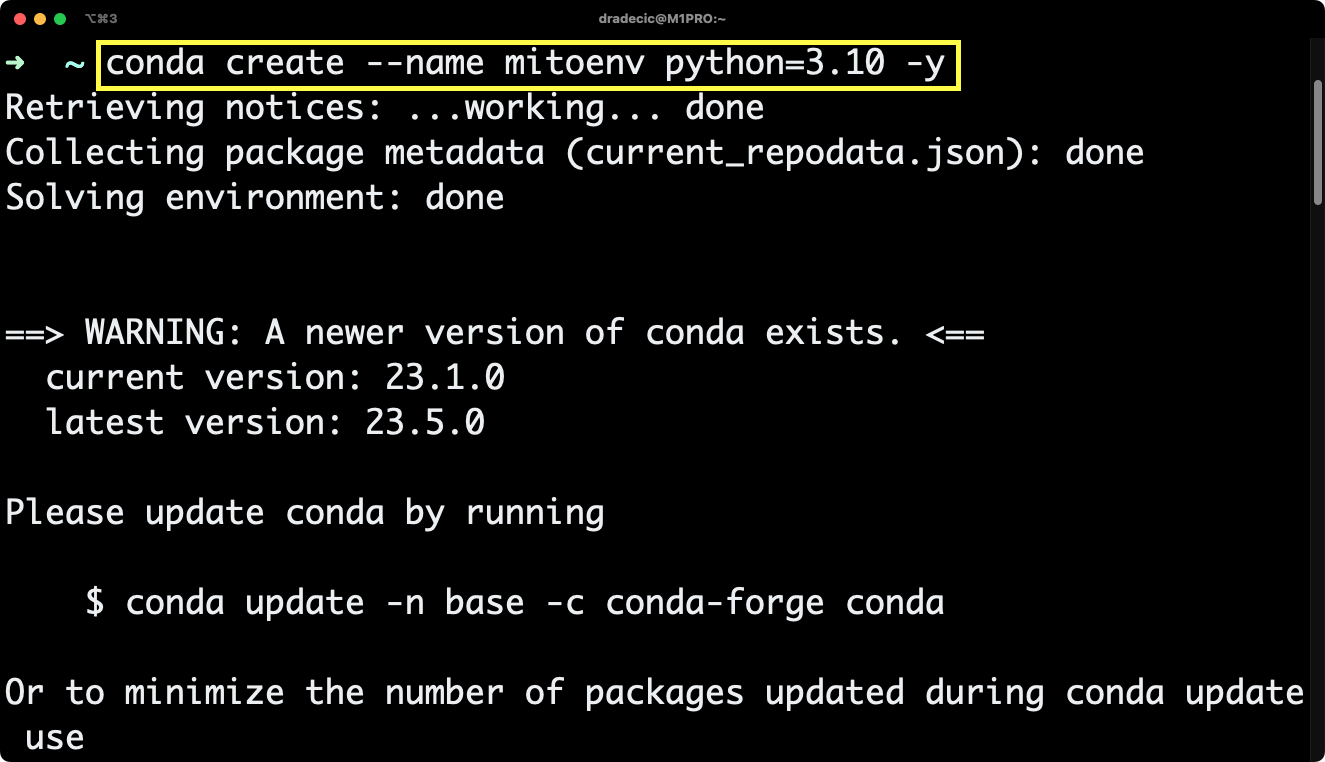
Image 1 - Creating a new Anaconda virtual environment for Mito (image by author)
The environment is now created, and you can activate it with the following shell command (Anaconda):
conda activate mitoenv
The equivalent venv command is:
mitoenv\Scripts\activate.bat
Whatever the case, you should see the environment name in brackets after the activation:
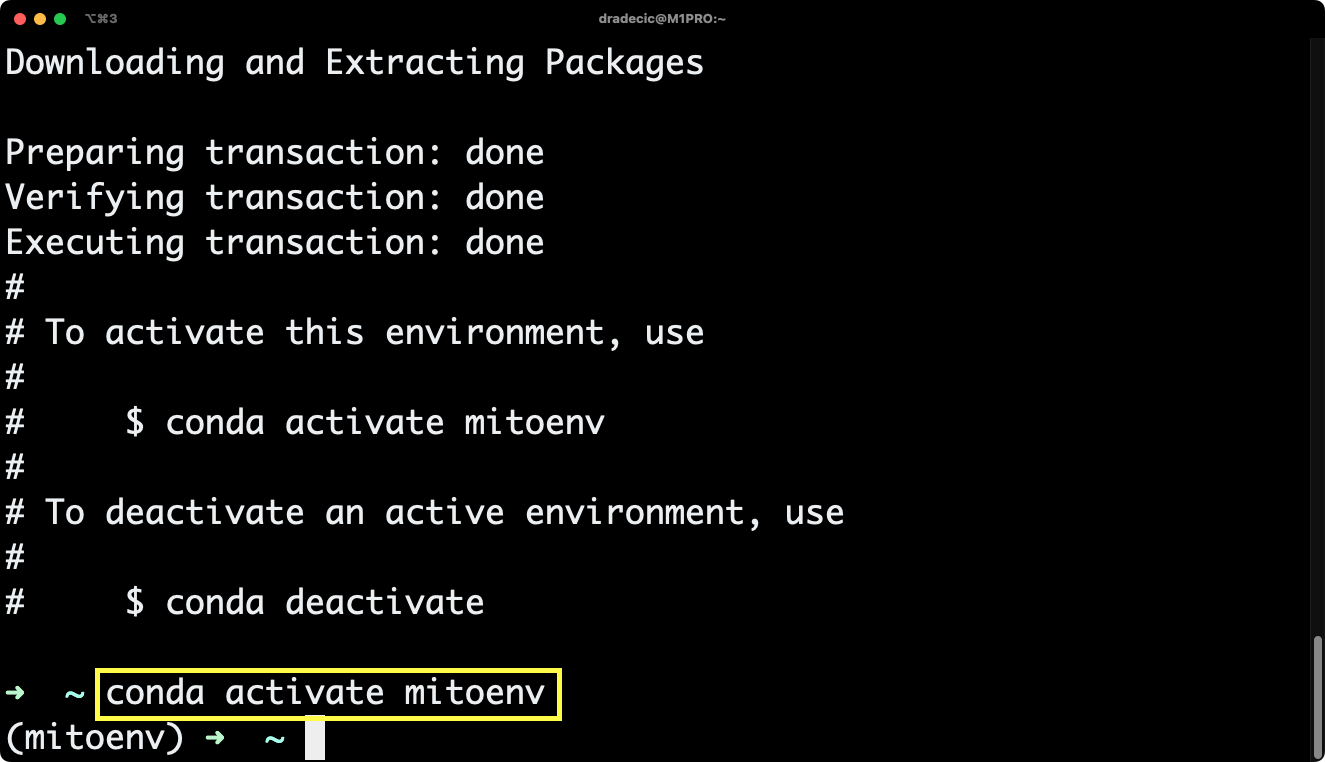
Image 2 - Activating the environment (image by author)
Now it’s time to install the mitoinstaller. This shell command works irrelevant of your Python environment manager:
python -m pip install mitoinstaller
It will take a couple of seconds to collect some dependencies:
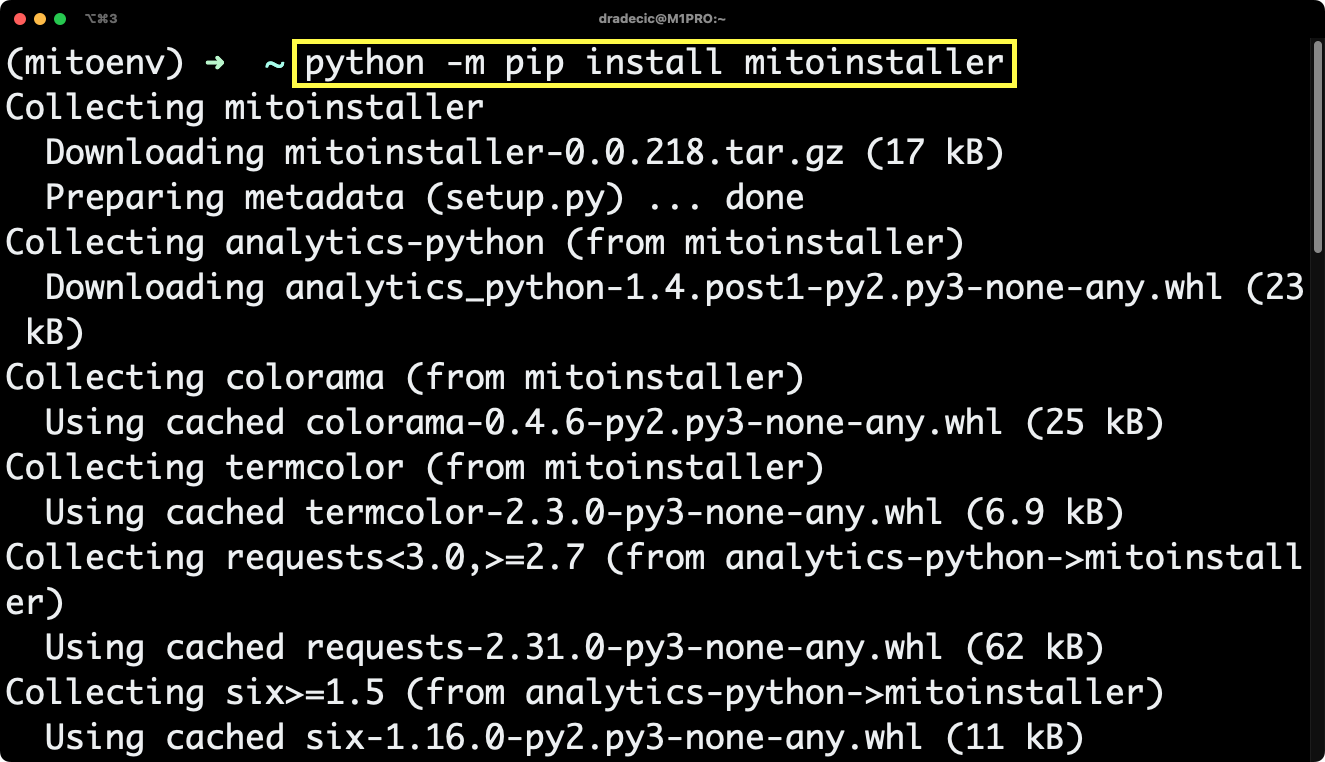
Image 3 - Installing Mitoinstaller (image by author)
And finally, you need to run the following command to install Mito:
python -m mitoinstaller install
Here’s what you should see in the terminal:
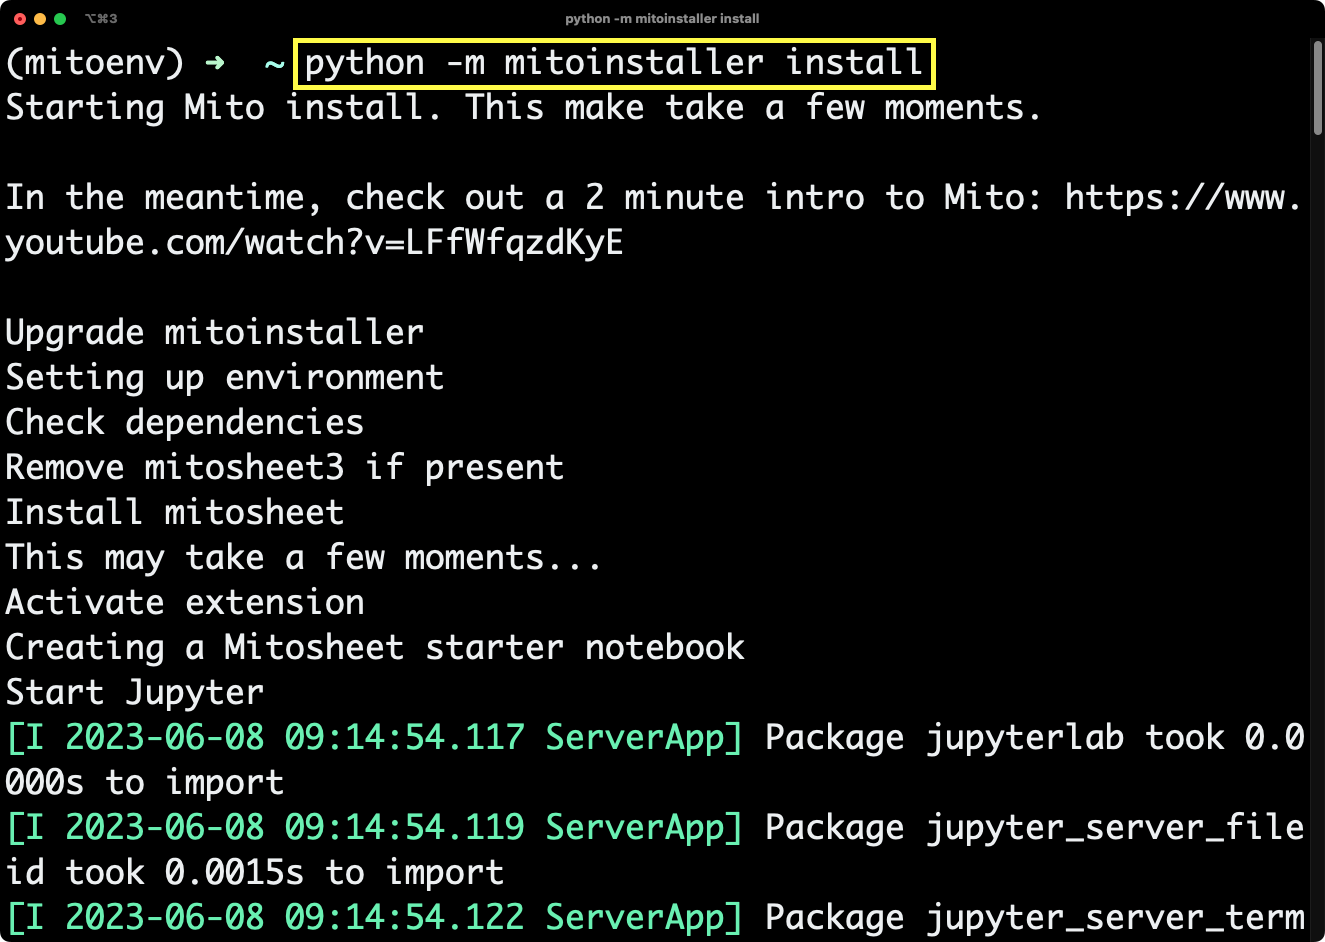
Image 4 - Installing Mito (image by author)
Once Mito is installed, the terminal will automatically open a new JupyterLab window. If you’re unfamiliar with it, it’s an interactive IDE you can use when writing Python code.
It’s also a required IDE to run Mito, since the frontend portion of Mito is a JupyterLab extension.
Mito Starter Notebook
Your JupyterLab session will open a starter Mito notebook. You’ll see the following code inside it:
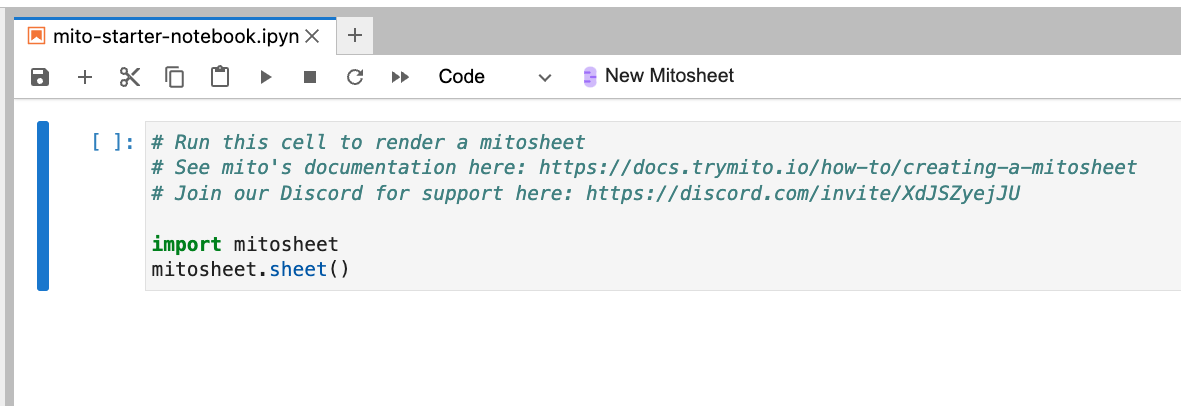
Image 5 - Mito default notebook (image by author)
You can run it, and you’ll get a modal window asking you to sign up. This process is free, but you can always upgrade if you need more features:
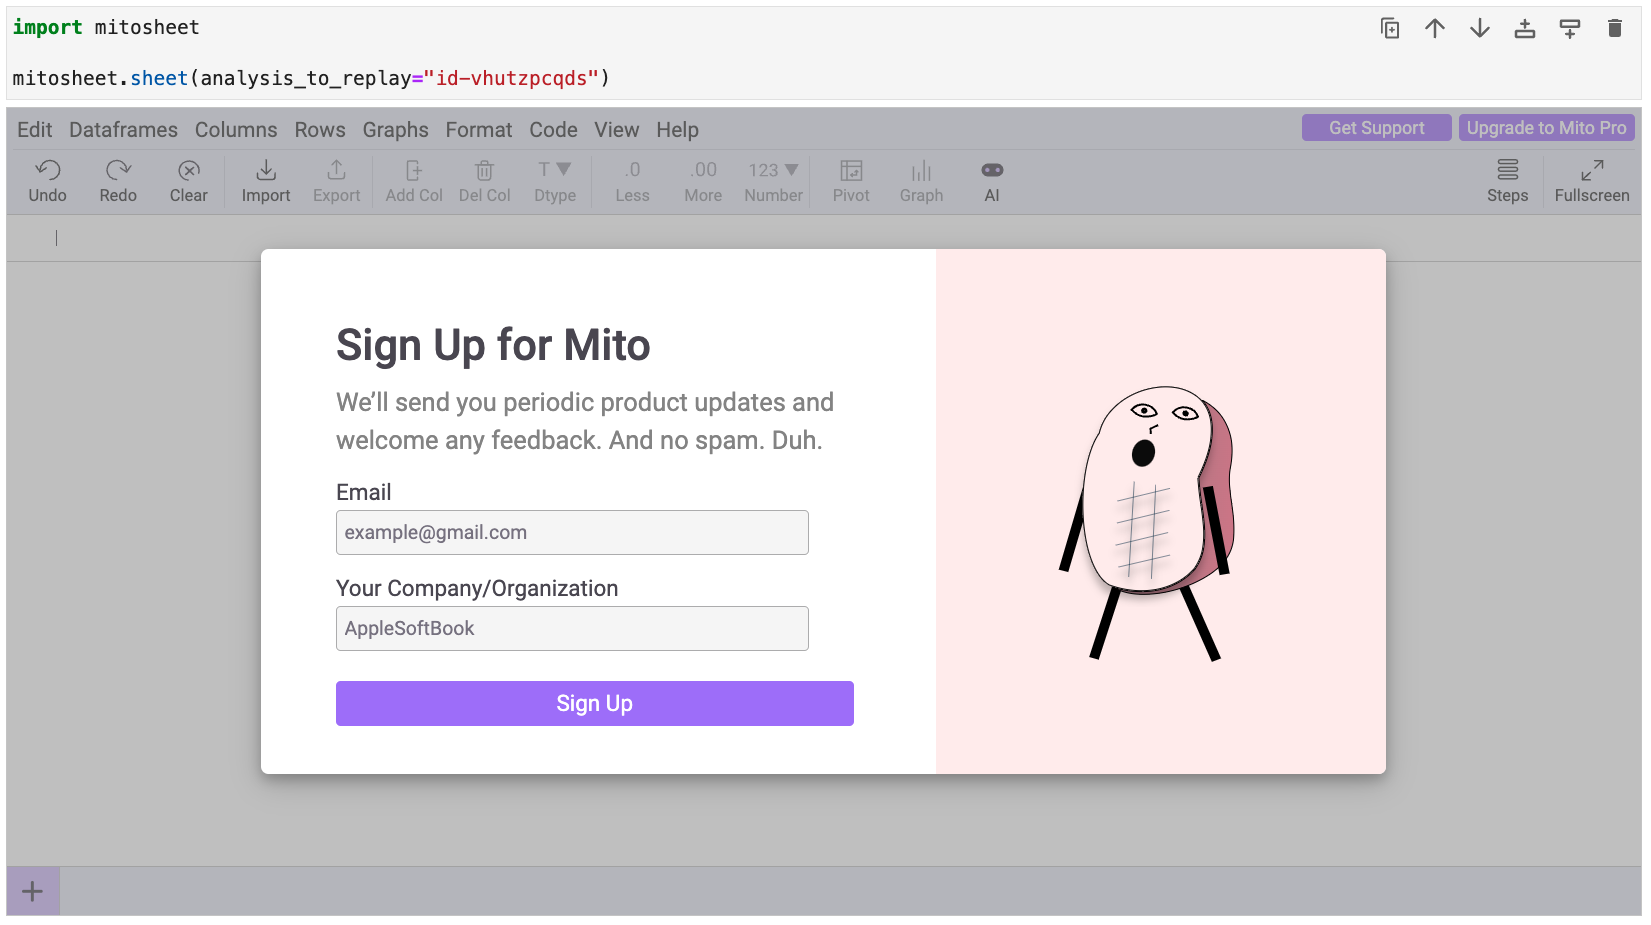
Image 6 - Signing up with Mito (image by author)
Once signed up, you’ll be good to go. Let’s see how to import a data file next.
Importing Files to Mito
You’ve now signed up for a free Mito account, which means you can start exploring everything it has to offer.
The first thing you’re presented with is a big purple button with the text “Import Files”:
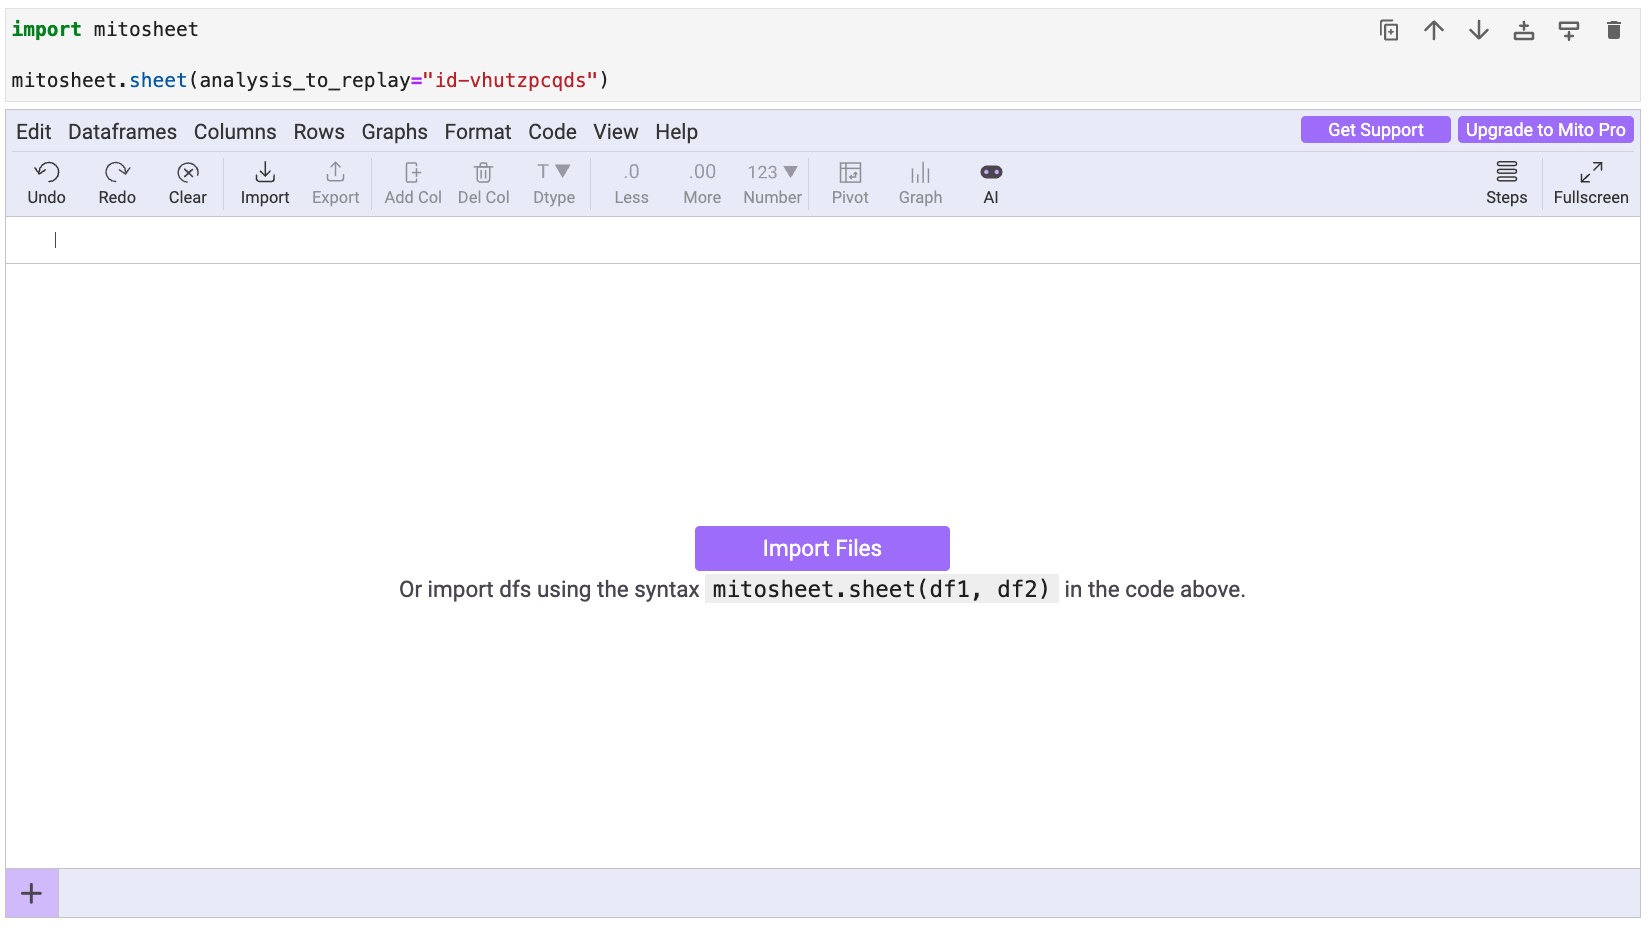
Image 7 - Data import (1) (image by author)
As the name suggests, it’s responsible for uploading local files to the Mito worksheet. I’ll use the Titanic dataset since it’s well-known to everyone in data science, and recommend you to do the same. Once you’ve selected it, click on the “Import” button:
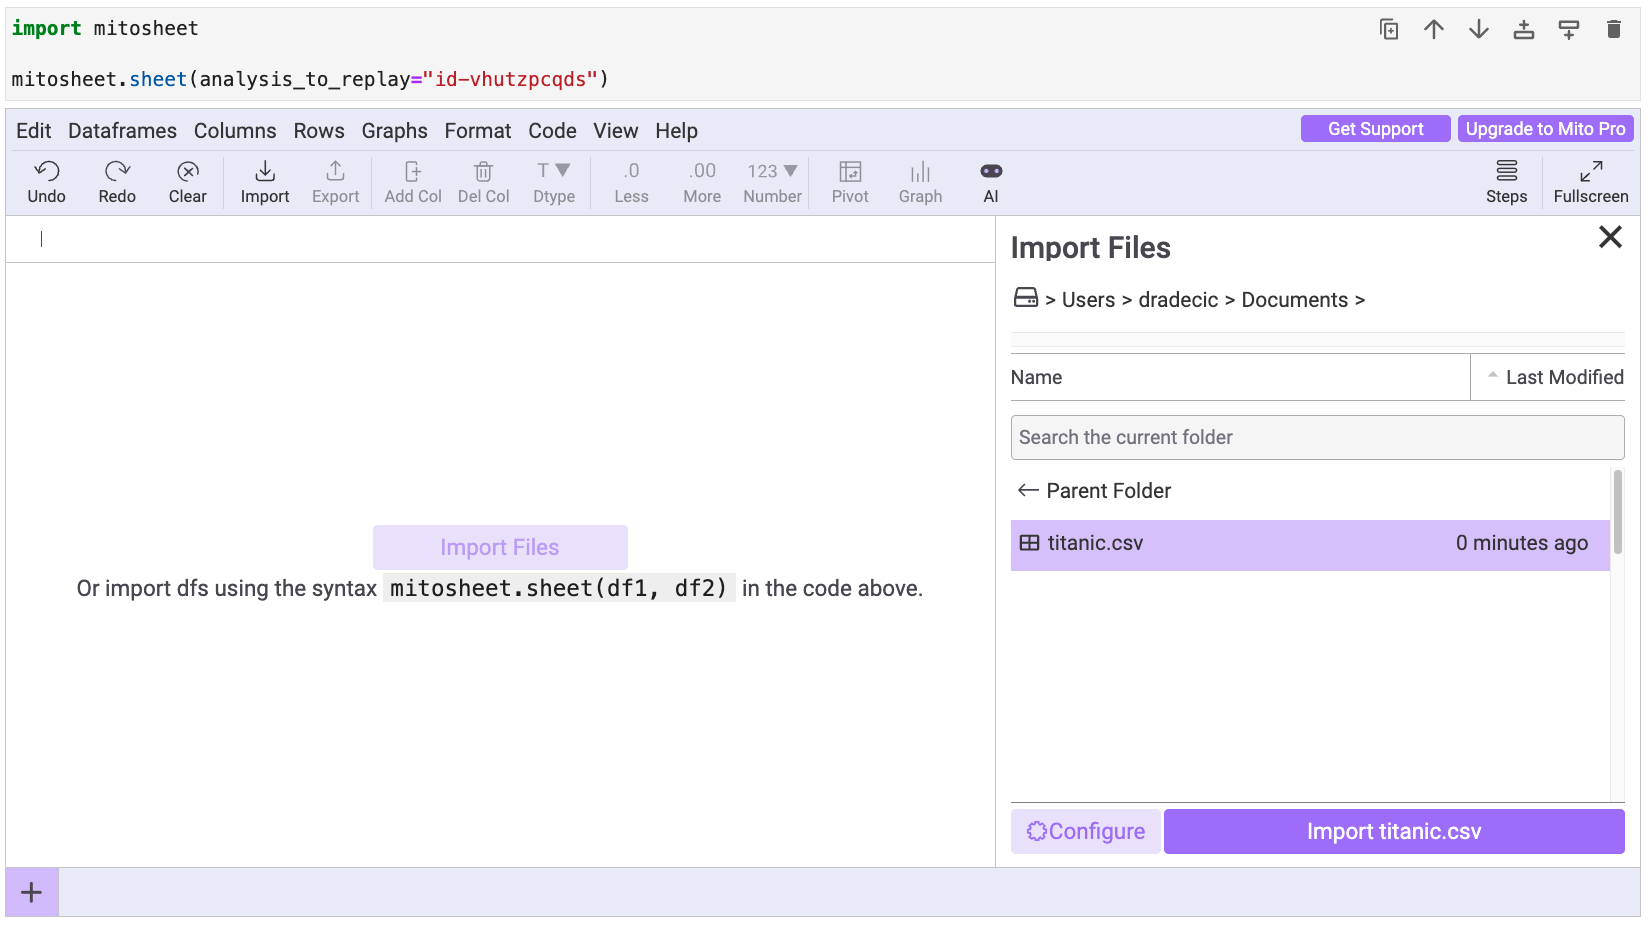
Image 8 - Data import (2) (image by author)
You’ll immediately see an Excel-like spreadsheet with your data. Mitosheet has many Excel functionalities, sure, but we won’t go through these today. Instead, we’ll focus on the last icon you see in the menu - AI:
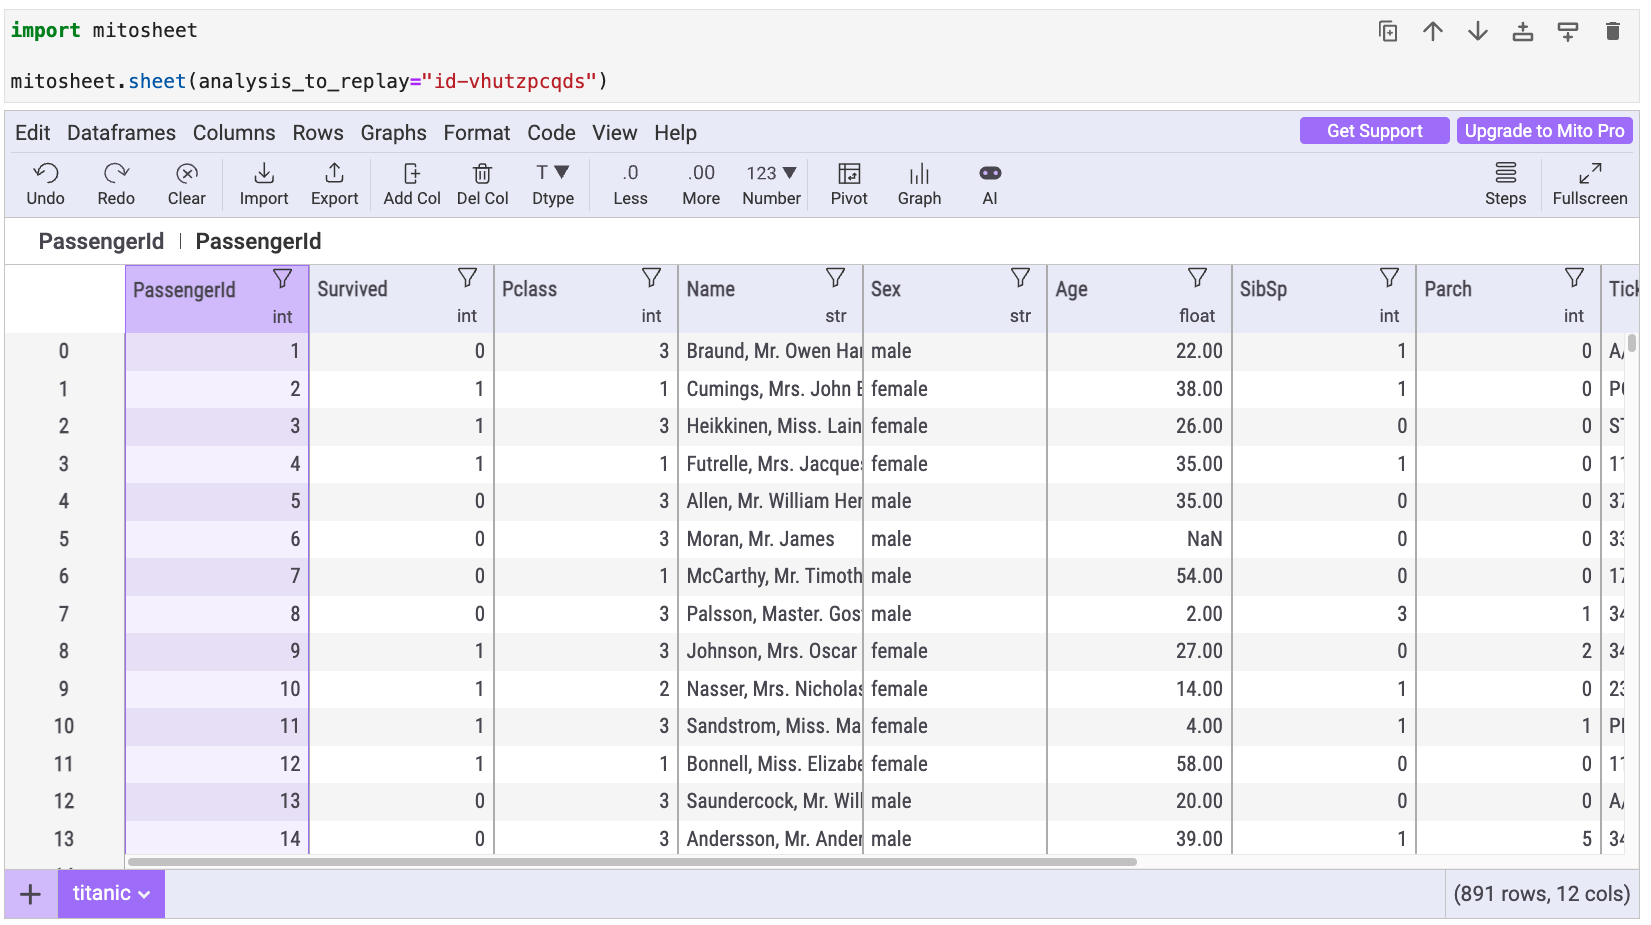
Image 9 - Data import (3) (image by author)
FYI, importing the dataset through Mito’s frontend functionality has automatically generated Python code in the code cell below:
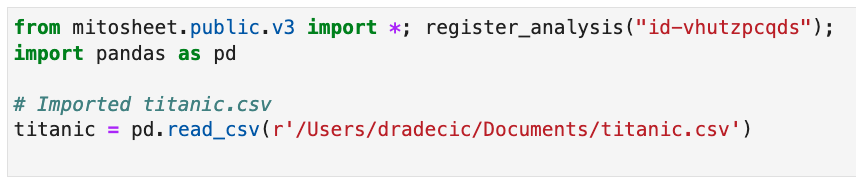
Image 10 - Generated Python code for data import (image by author)
That’s the true power of Mito - you work on your data just like in Excel, and it automatically generates reproducible Python code for you.
Okay, we have the data now, so it’s time to explore the AI functionality.
Mito AI in Action - How Good is it?
This section of the article will walk you through 8 prompts of different complexities. Remember, the goal is to write a question in plain English and let Mito AI (ChatGPT + Pandas) take care of the rest.
To start, click on the “AI” icon in the top menu.
Prompt #1
As soon as you click on the “AI” button, you’ll be presented with a couple of prompts for your dataset. For example, one for the Titanic dataset is “extract the first character from Name”.
Clicking on it will do the exact operation and reassign the results back to the Name attribute:
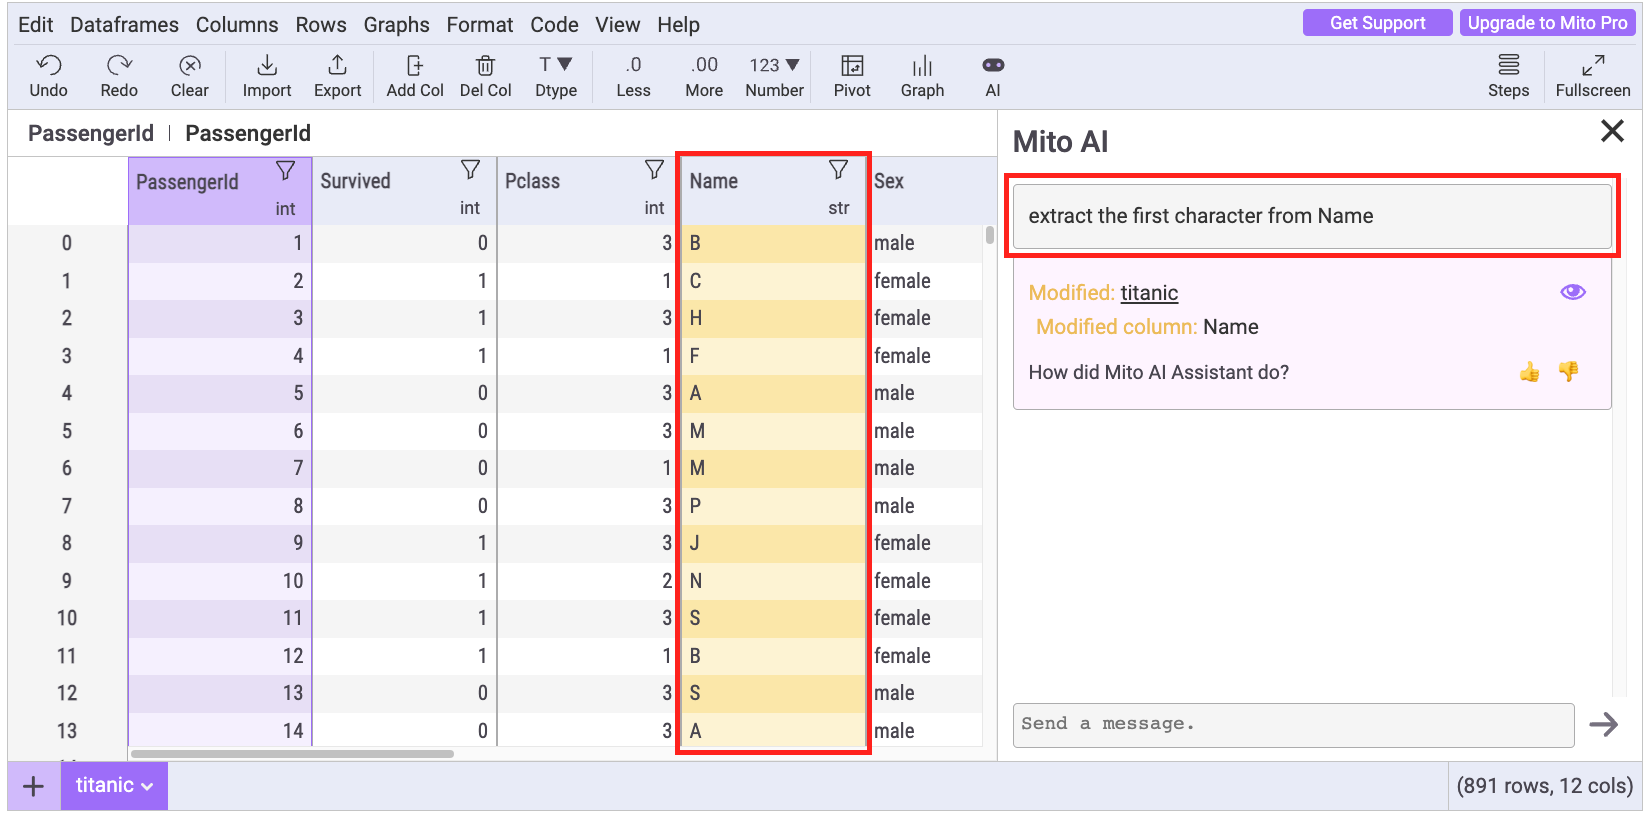
Image 11 - Prompt results (image by author)
This is the code generated by Mito AI:
# extract the first character from Name
titanic['Name'] = titanic['Name'].str[0]
It’s a good introductory example, and you can always click on “Undo” if you don’t like the implementation.
Prompt #2
Now let’s get into the good stuff and preprocess the Sex attribute. Currently, it contains string data, which isn’t adequate for most machine learning models. The prompt you’re about to see replaces textual data with numbers and also renames the column:
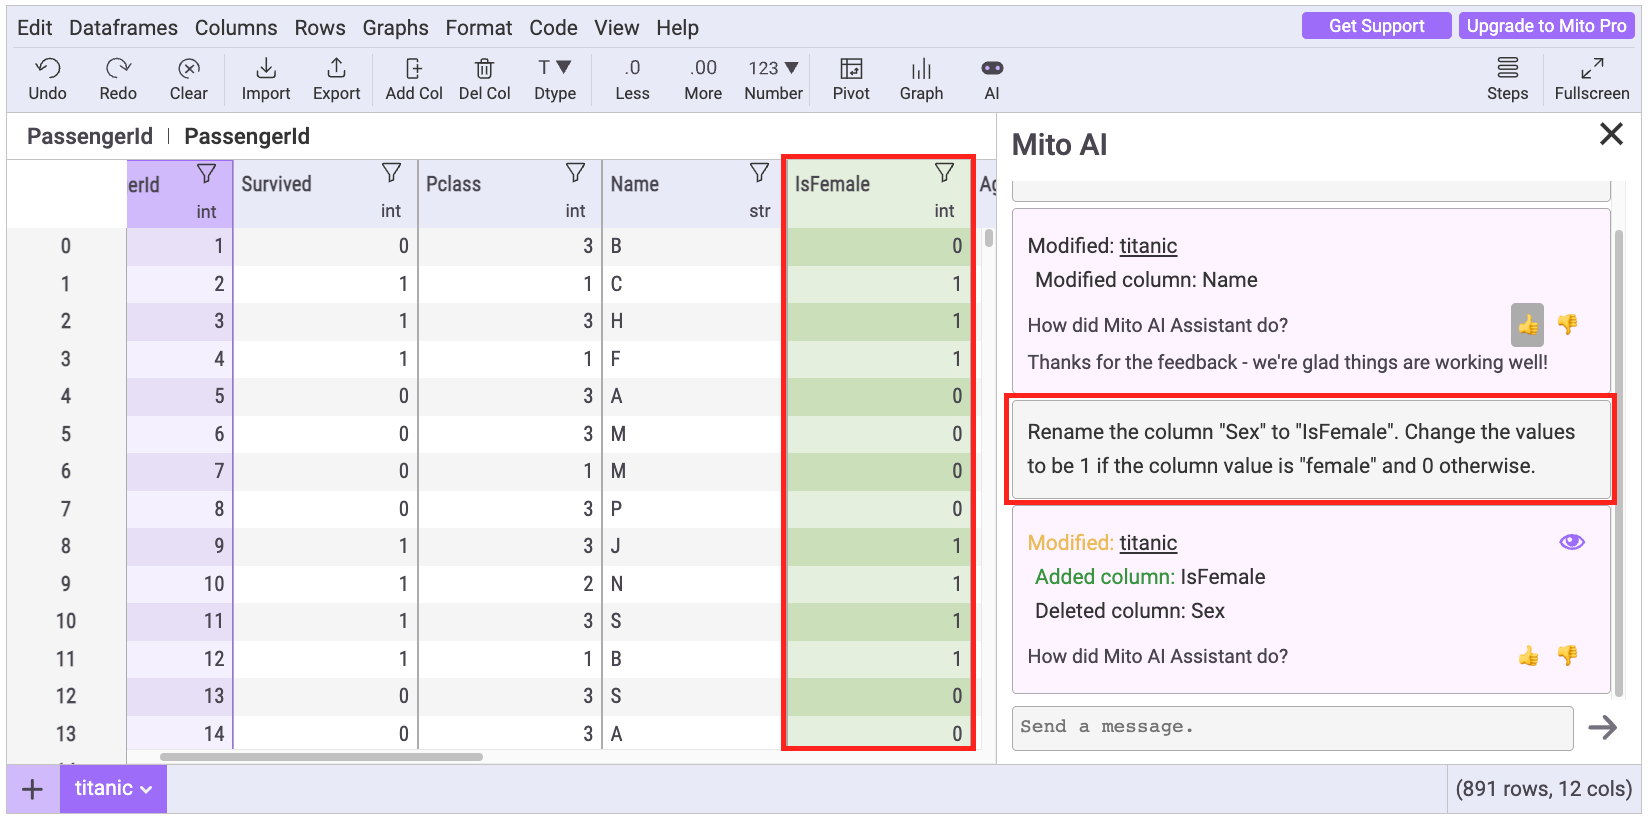
Image 12 - Prompt results (image by author)
For reference, this is the generated Python code:
# Rename the column "Sex" to "IsFemale". Change the values to be 1 if the column value is "female" and 0 otherwise.
titanic.rename(columns={'Sex': 'IsFemale'}, inplace=True)
titanic['IsFemale'] = titanic['IsFemale'].apply(lambda x: 1 if x == 'female' else 0)
Mito AI did an amazing job here. The code looks identical to what I would write when working on this dataset.
Prompt #3
The Age column contains some missing values. Can Mito impute them?
Let’s see. This prompt instructs Mito AI to impute missing values with the median value:
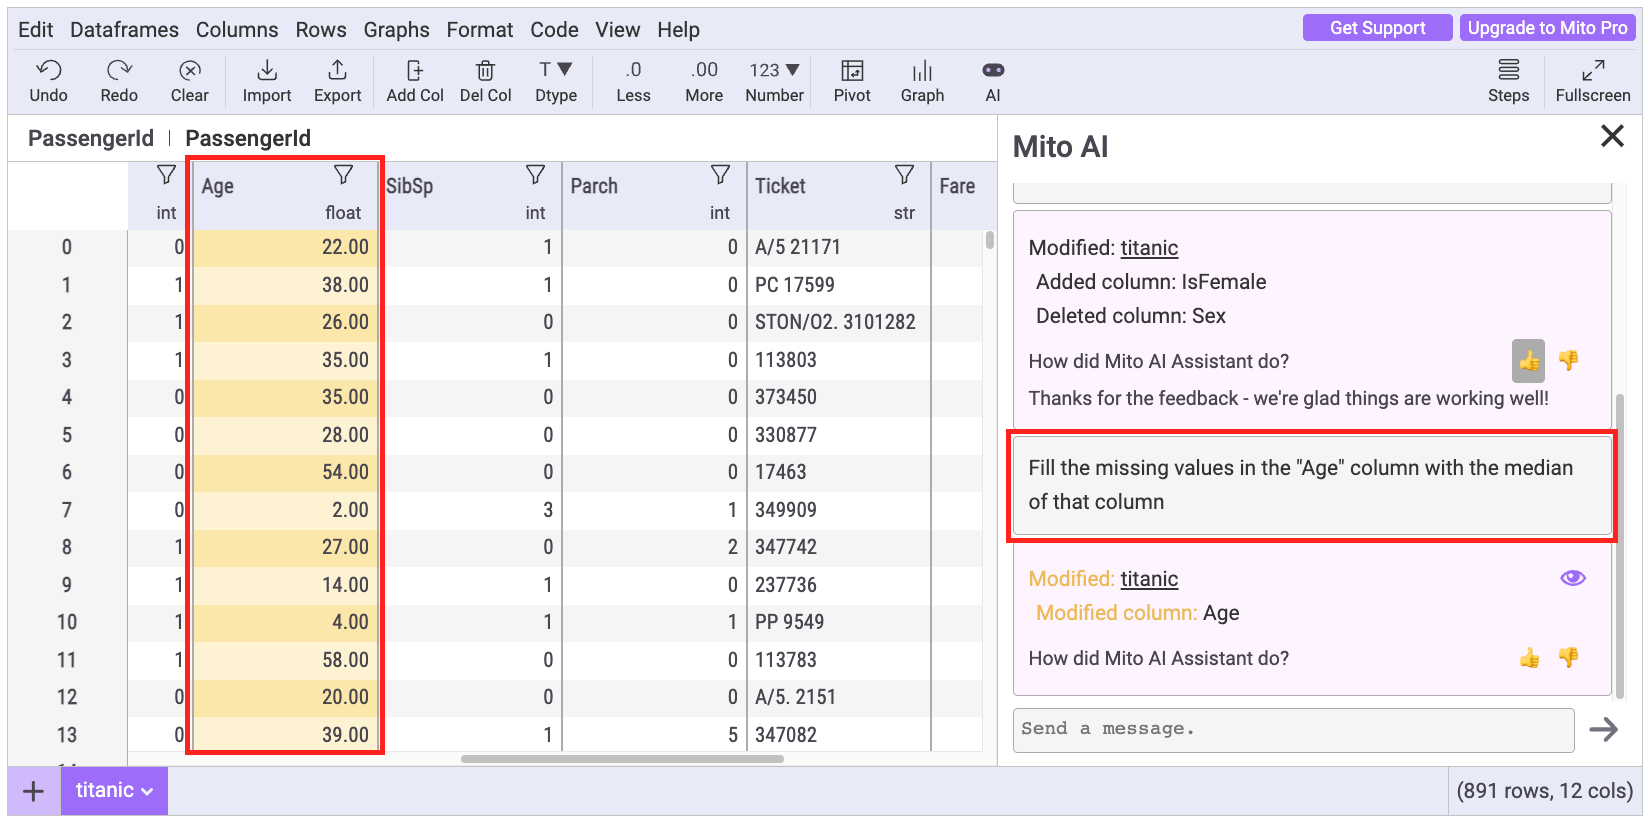
Image 13 - Prompt results (image by author)
Generated Python code leverages the fillna() function from Pandas:
# Fill the missing values in the "Age" column with the median of that column
titanic['Age'].fillna(titanic['Age'].median(), inplace=True)
So far, so good. Mito has successfully imputed missing values.
Prompt #4
Is Mito AI limited to modifying DataFrames or can it also report calculation results? That’s an interesting question I’m sure you have had by now.
The following prompt asks what’s the average value in the Fare column. In other words, I want to know what is the mean $ amount passengers paid to embark on the ship. Here are the results:
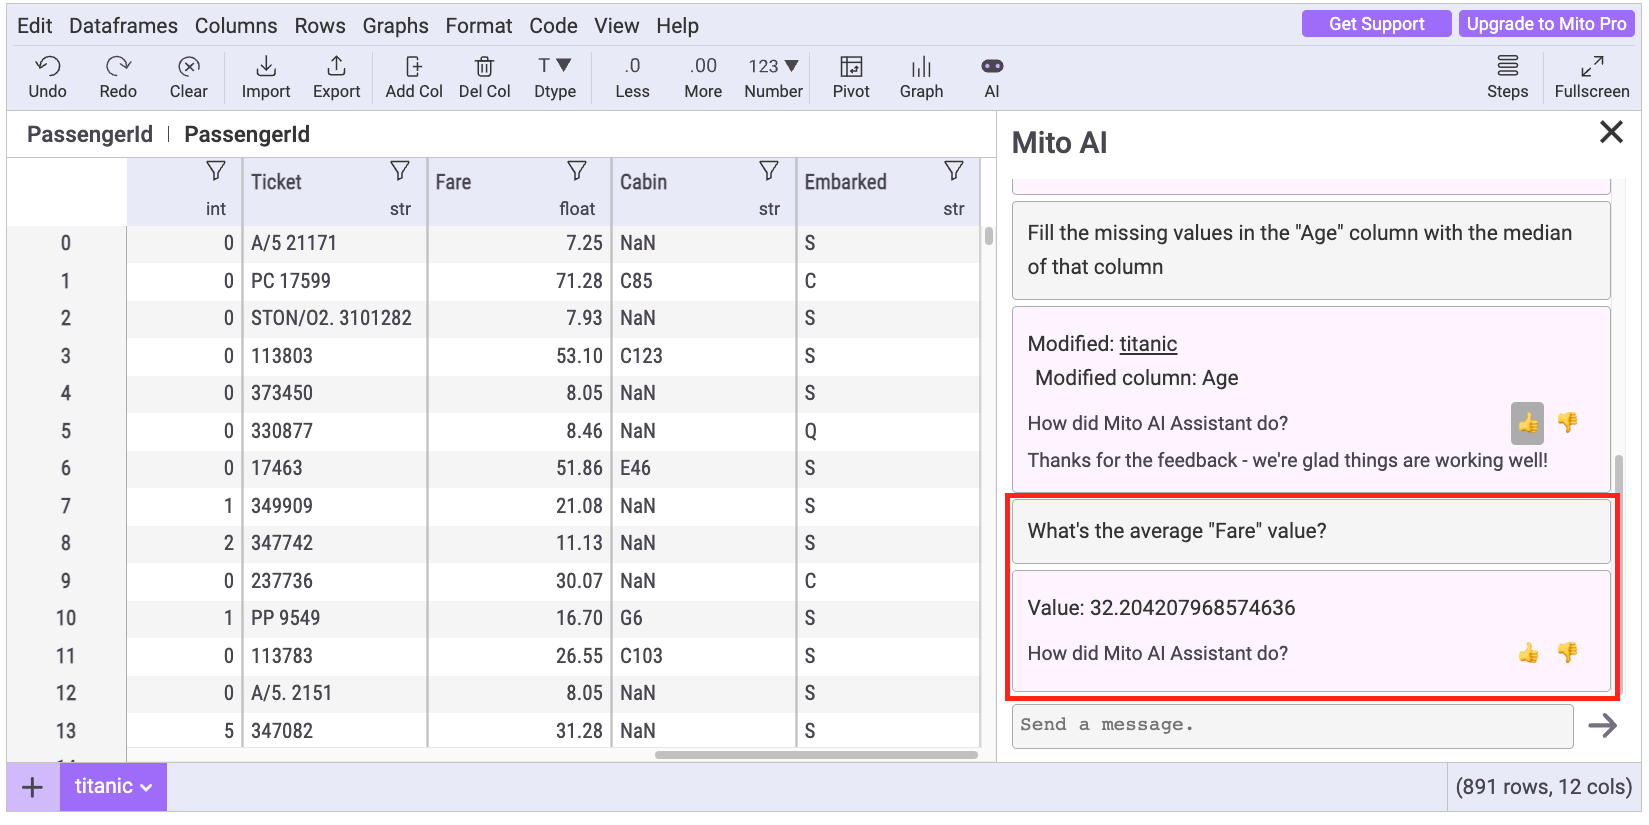
Image 14 - Prompt results (image by author)
The Python code that’s generated won’t modify the DataFrame, but you can use it to print the calculation result:
# What's the average "Fare" value?
titanic['Fare'].mean()
Long story short, Mito AI had no trouble understanding my instructions and implementing them in code.
Prompt #5
The following prompt asks Mito to generate Python code for removing a couple of features - PassengerId, Ticket, Cabin, and Embarked. These are the ones you’d likely remove when building a machine learning model.
Here are the results:
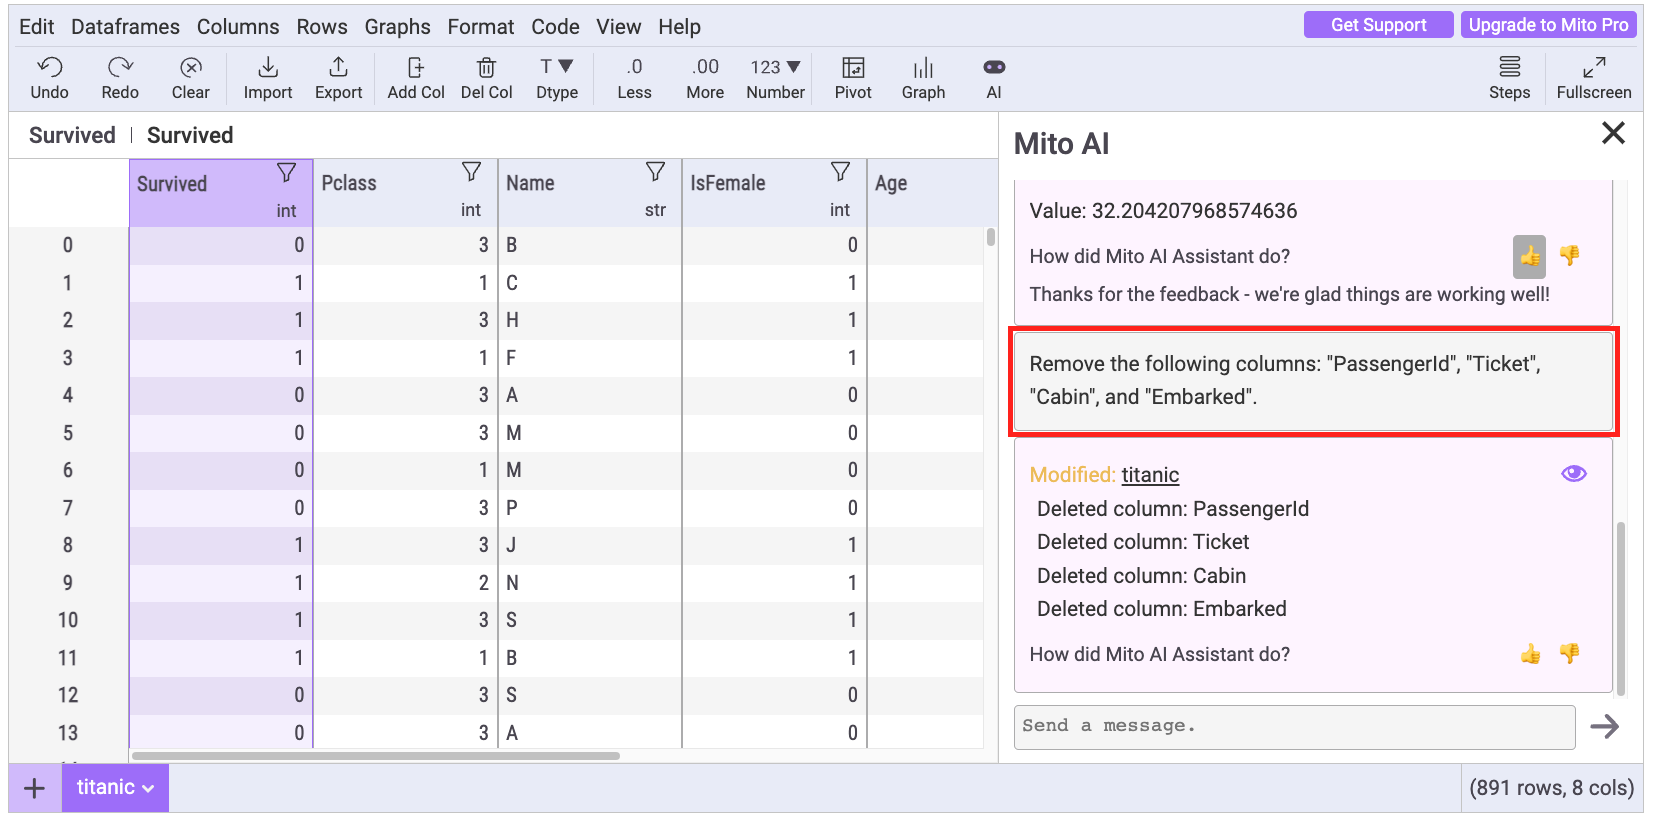
Image 15 - Prompt results (image by author)
As per usual, this is the code generated by Mito AI:
# Remove the following columns: "PassengerId", "Ticket", "Cabin", and "Embarked".
titanic.drop(['PassengerId', 'Ticket', 'Cabin', 'Embarked'], axis=1, inplace=True)
I’ve asked five simple questions until now, and Mito got all of them right. Let’s increase complexity a bit to see what will happen.
Prompt #6
Now I want to ask a slightly more challenging question, and that is to divide the Fare columns into bins, where each bin has records separated 10 units apart. For example, from 0 to 10, from 10 to 20, and so on.
At first glance, Mito AI returns somewhat of a strange result:
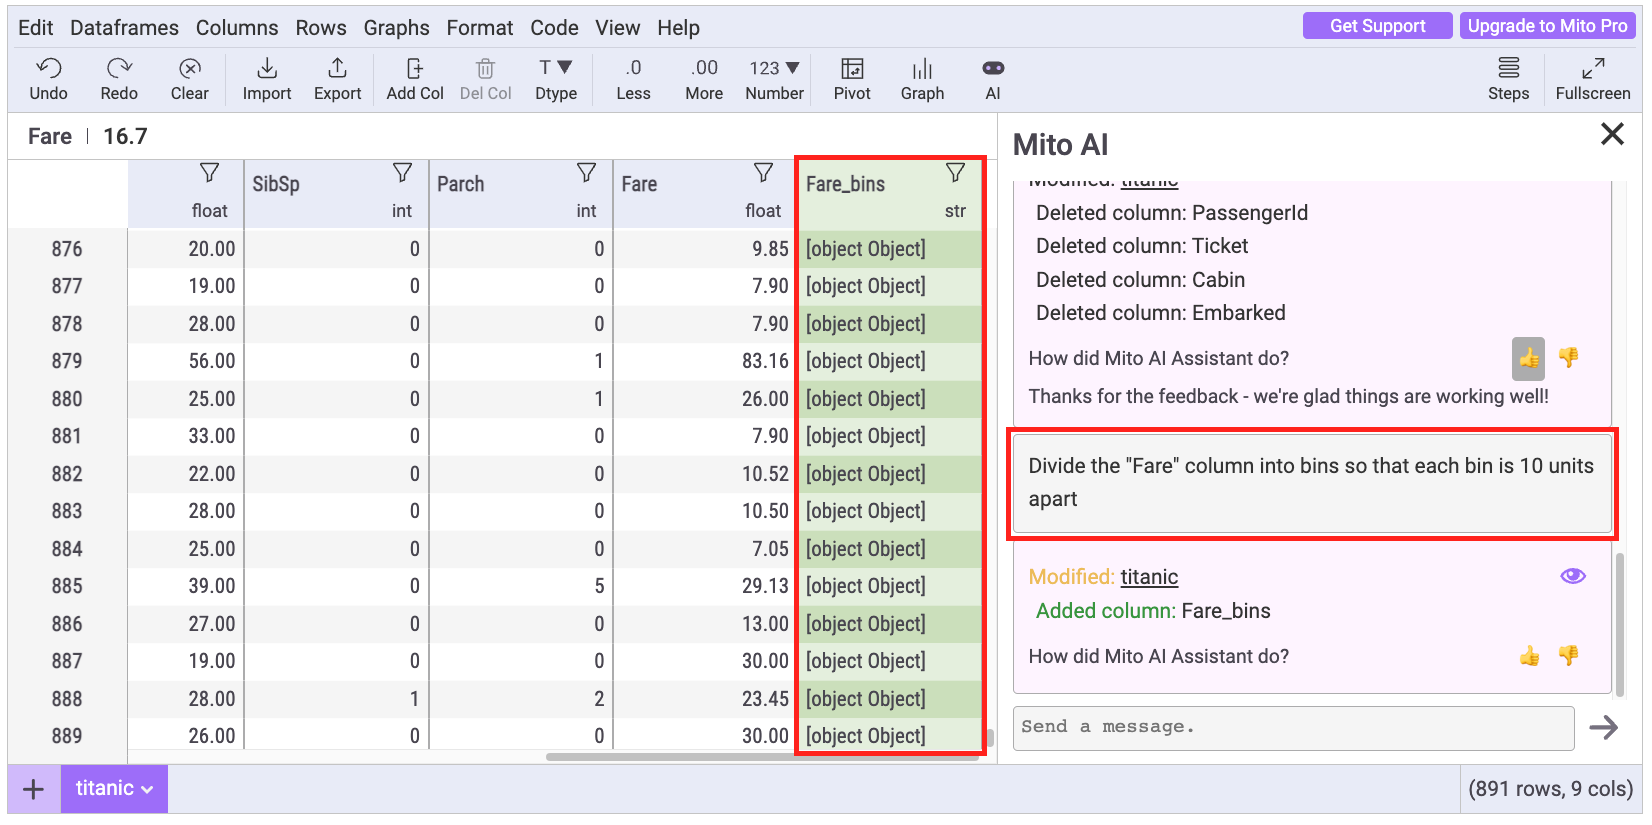
Image 16 - Prompt results (image by author)
But the generated Python code looks as it should:
# Divide the "Fare" column into bins so that each bin is 10 units apart
titanic['Fare_bins'] = pd.cut(titanic['Fare'], bins=range(0, int(titanic['Fare'].max())+10, 10), include_lowest=True)
To inspect further, I’ve run all of the Python code generated by Mito and then called the head() function to see what the data looks like:
titanic.head()
The Fare_bins column looks normal, and the values look to be in the correct range:
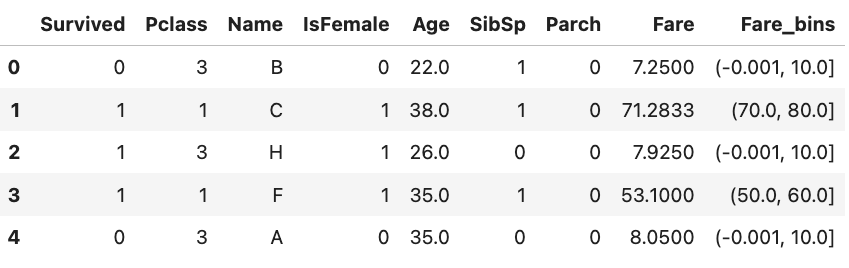
Image 17 - Head of the modified dataset (image by author)
Let’s further inspect by calling value_counts() - this function will count the values of the attribute by category:
titanic["Fare_bins"].value_counts()
Here’s the result:
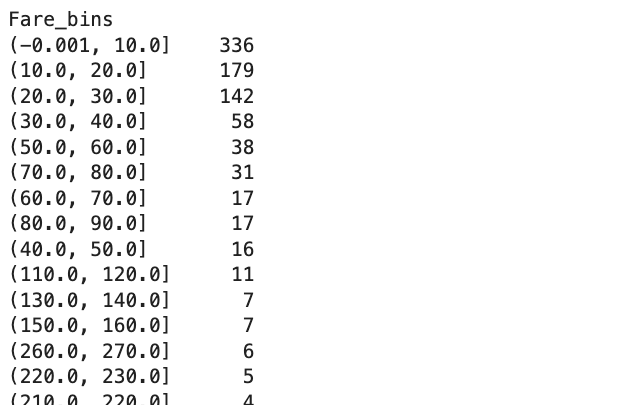
Image 18 - Value count results (image by author)
Yup - everything looks fine. The mitosheet seems to have some trouble rendering bin values, but the actual code works as expected.
Prompt #7
What do you think will happen if you ask Mito AI a somewhat longer question? Will it be able to connect the dots? Or will it forget what was instructed at the start of the prompt? There’s only one way to find out.
The goal now is to count how many passengers have at least 1 SibSp and Parch, as you can see from the prompt and the answer below:
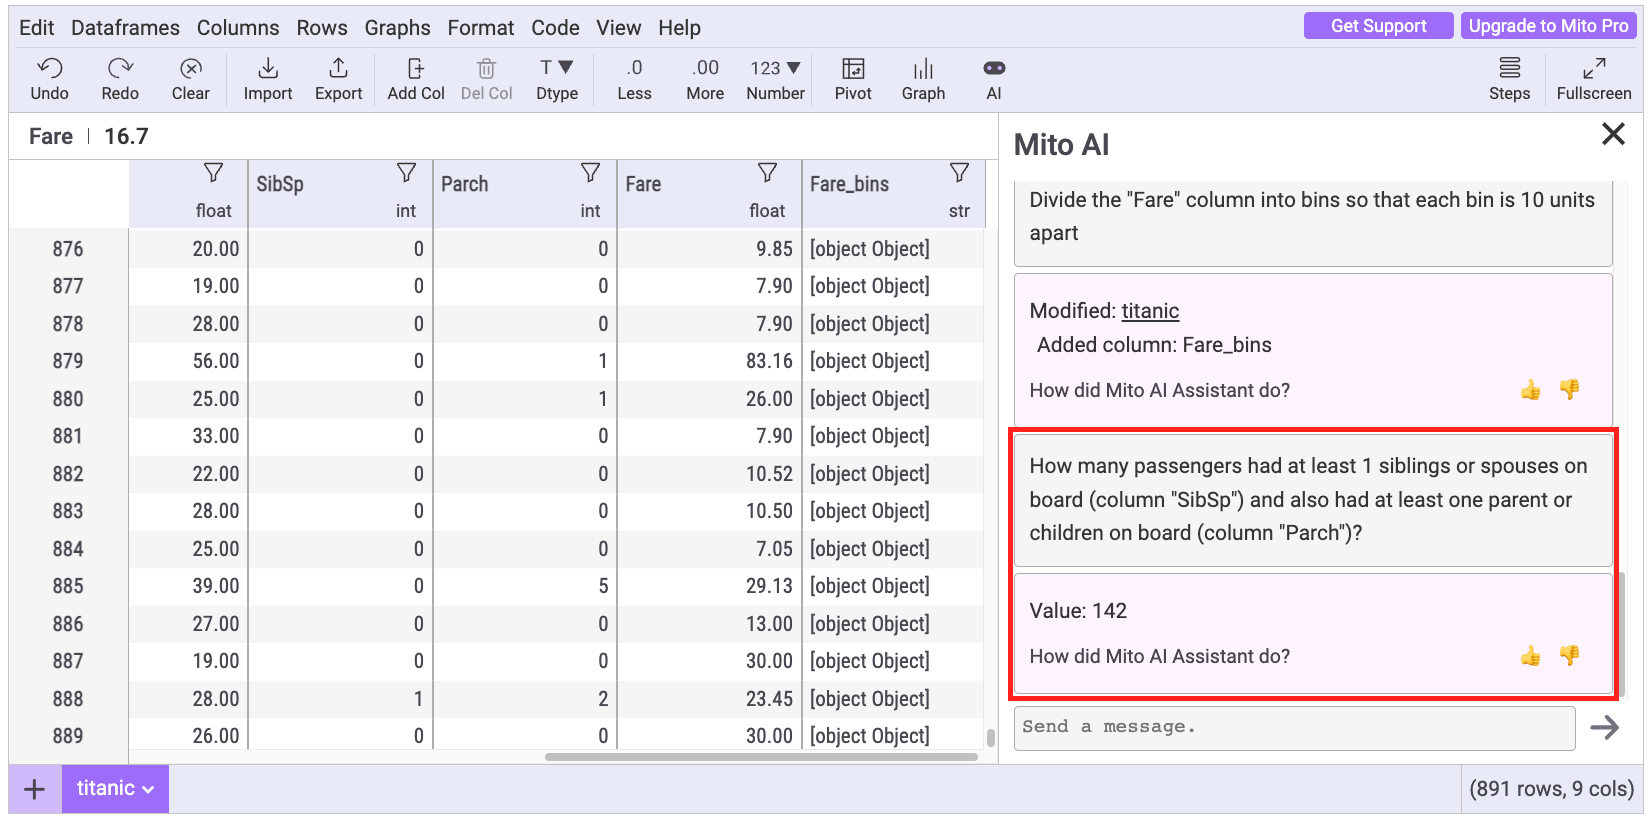
Image 19 - Prompt results (image by author)
When it comes to Pandas code, Mito has no trouble chaining multiple conditions when filtering records:
# How many passengers had at least 1 siblings or spouses on board (column "SibSp") and also had at least one parent or children on board (column "Parch")?
titanic[(titanic['SibSp'] >= 1) & (titanic['Parch'] >= 1)].shape[0]
Seven down, one to go!
Prompt #8
Mito wasn’t designed to be a data visualization tool. There are charting options, sure, but the main purpose of the library is to provide an Excel-like interface for Pandas.
What will happen if we ask it to make a chart, for example, a histogram based on the Age column? Let’s find out:
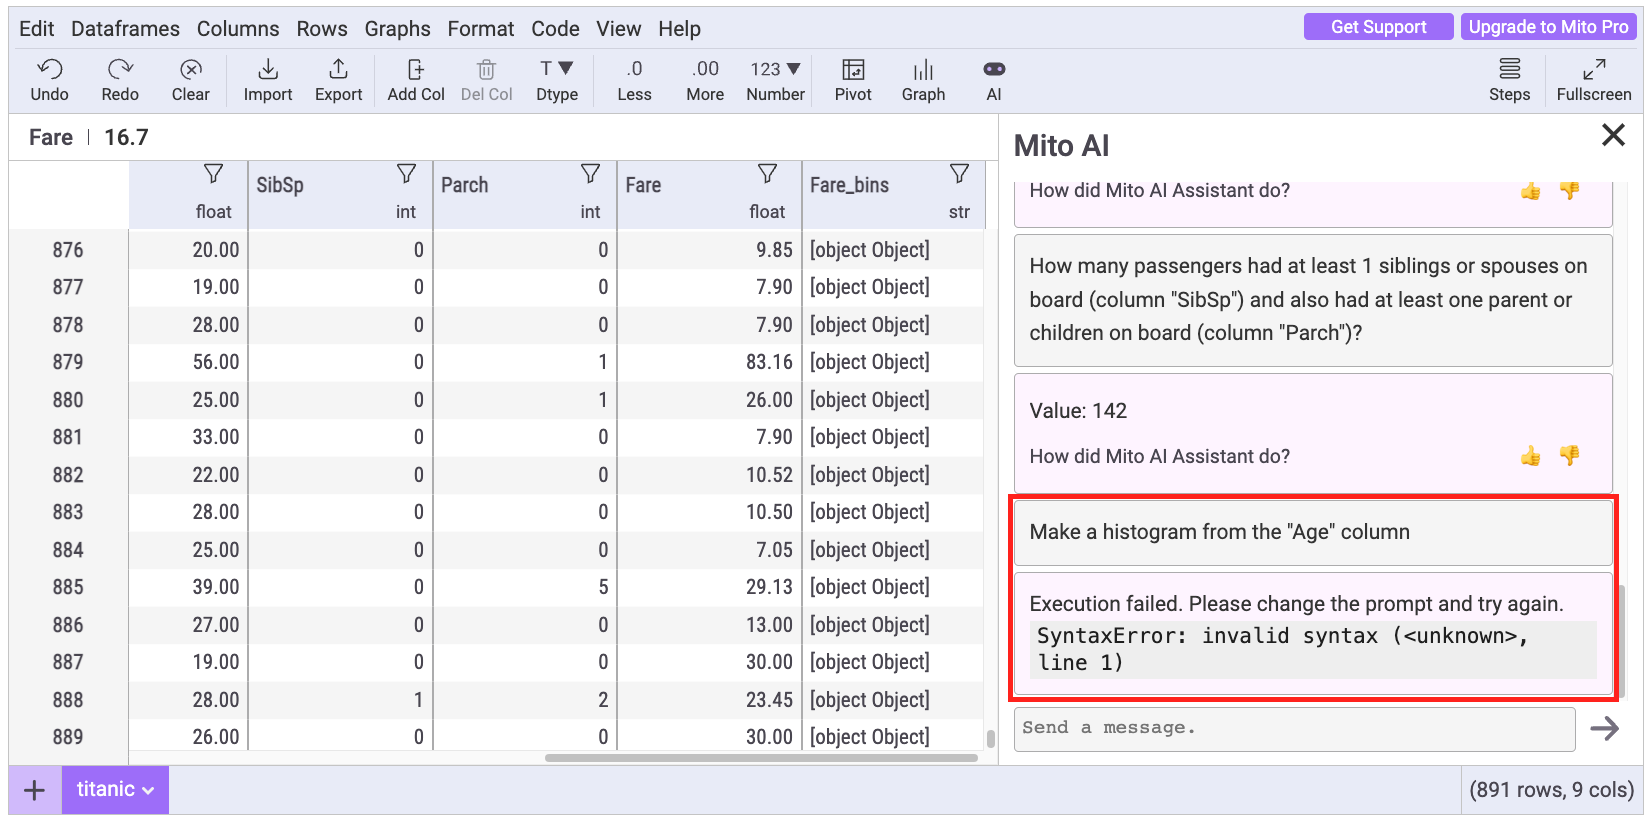
Image 20 - Prompt results (image by author)
This time we get an error, and no Python code is generated. No matter what, I haven’t managed to use prompts to get a chart code from Mito. Let me know if you manage to do so.
Mito AI Options and Limitations
Everything covered so far sounds great, so where’s the catch? Well, there isn’t any, especially if you take into account that requests to the OpenAI API cost money. The longer your prompt is and the longer the response is, the more money it costs.
That being said, the free version of Mito AI still allows you to make 100 free code completions.
If you opt for a Pro plan ($49.99/month as of June2023), you’ll get unlimited OpenAI completions. That’s a lot of bang for not so much buck.
In addition, you can also provide your own OpenAI API key to get rid of the 100 prompt limit. Just keep in mind that your credit card will be charged per request in this case.
Further, you can opt for the Enterprise plan plan and build your own On-Prem AI by connecting to local LLMs instead of OpenAI. This allows you unlimited AI completions and makes sure no data leaves your organization.
Summing up Mito AI
At the end of the day, Mito AI provides a revolutionary way to work with Pandas. The tool was superb even before the AI features, since it allowed you to edit Pandas DataFrames as Excel spreadsheets and automatically get the required Python code. These AI features are just icing to the cake.
Given the cost of the OpenAI API, I’d say that the free 100 requests are more than generous. You can scale up to the Pro plan if you want more, bring your own OpenAI key, or scale up to the Enterprise plan to work with local LLMs.
Whatever you choose, you won’t choose wrong.