Spark is based on Resilient Distributed Datasets (RDD) - Make sure you know how to use them
RDDs, or Resilient Distributed Datasets are core objects in Apache Spark. They are a primary abstraction Spark uses for fast and efficient MapReduce operations. As the name suggests, these datasets are resilient (fault-tolerant) and distributed (can be spread out on different nodes of a cluster).
There’s a lot to learn when it comes to RDDs in Spark that I don’t plan to cover today. If you’re interested in the theory and inner-workings, please refer to this introductory article by XenonStack.
So, what will we do today? We’ll tackle Spark RDDs hands-on. We’ll write an entire Spark script that processes values of the Iris dataset. To be more precise, we’ll calculate the averages of the sepal length attribute among different species. It feels like buying a race car for weekly grocery shopping, but you’ll learn a lot in the process.
If you need a reference for installing Apache Spark in Python, look no further:
Apache Spark for Data Science - How to Install and Get Started with PySpark
As always, I’ve covered the same topic in video format, if that’s what you prefer:
How to Read a Text File as a Spark RDD
As always, the first thing you have to do is to initialize a new Spark session. Use the following snippet as a reference for local environments:
from pyspark import SparkConf, SparkContext

conf = SparkConf().setMaster("local").setAppName("IrisSLMeans")
sc = SparkContext(conf=conf)
From here, use the textFile() method to read a text file from the disk. Remember to put file:// before the path, as Spark won’t be able to find it otherwise:
iris = sc.textFile("file:///Users/dradecic/Desktop/iris.csv")
iris.collect()[:10]
The collect() action method is used to get the result out of an RDD - in this case, it prints the first ten rows:
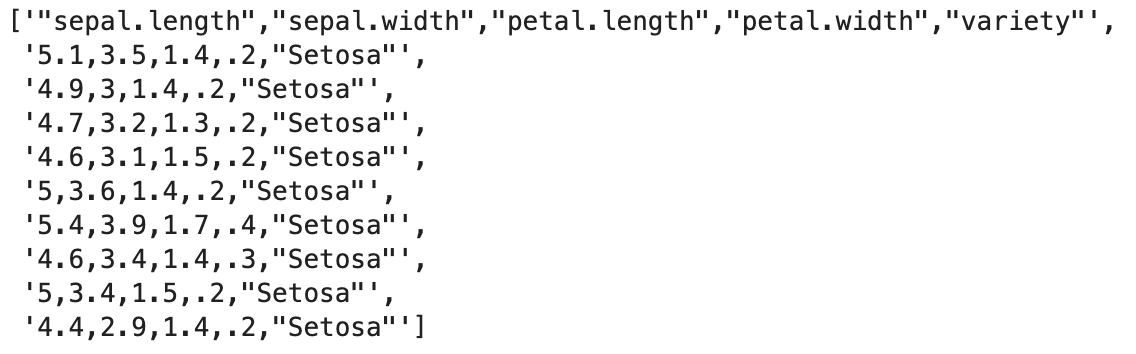
Image 1 - Reading a text file with Spark (image by author)
Problem - the text file contains a header row which we don’t need. There’s no obvious way to remove it when using Spark RDDs only. What you can do is the following:
- Extract the header row by calling
iris.first(). - The header row is now a plain Python string - we need to convert it to a Spark RDD. Use the
parallelize()method to distribute a local Python collection to an RDD. - Use the
subtract()method to, well, subtract the header from the dataset.
Here’s what it looks like in code:
iris_header = iris.first()
iris_header = sc.parallelize([iris_header])
iris = iris.subtract(iris_header)
iris.collect()[:10]
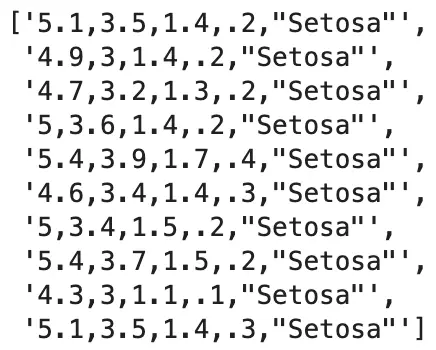
Image 2 - Removing the header row in Spark (image by author)
That’s something we can work with. Spark treats the entire row as a string. Essentially, we have an RDD that contains 150 strings. Let’s see how to parse the values next.
How to Parse Comma Separated Values with Spark
The values of our RDD are separated by a comma. To get individual values (just as you would in Pandas), we’ll have to split the line on the comma sign. From there, we’ll extract and return species and sepal length values as a tuple.
The described logic will be stored inside a Python function called parse_input():
def parse_input(line: str) -> tuple:
    cols = line.split(",")
    sepal_length = float(cols[0])
    species = str(cols[-1])
    return (species, sepal_length)
And now the beauty of Spark becomes visible. We’ll call the map() method and pass our function as a parameter:
iris_parsed = iris.map(parse_input)
iris_parsed.collect()[:10]
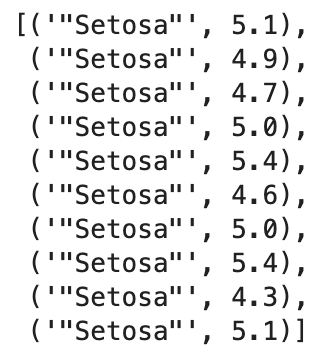
Image 3 - Using a custom map() function in Spark (image by author)
The RDD now looks a bit different - each value is a tuple with one string and one floating-point number. That’s all we need to calculate the averages per flower species.
Basic Spark MapReduce Task in Python
In Spark, you’ll often find map and reduce tasks chained together in a single line of code. It can be confusing to beginners, so I’ll break it up.
The end goal is to have values of sepal length summed up alongside the total number of species. For example, we want to see ("Setosa", (250.3, 50)), which means the 50 flowers of the Setosa species have a total sepal length of 250.3.
It’s easier said than done.
The first step is to convert x to (x, 1). This way, we can keep track of total sepal length and the total number of flowers per species in the reduce task. Use Python’s lambda function for the task:
iris_sl_totals = iris_parsed.mapValues(lambda x: (x, 1))
iris_sl_totals.collect()[:10]
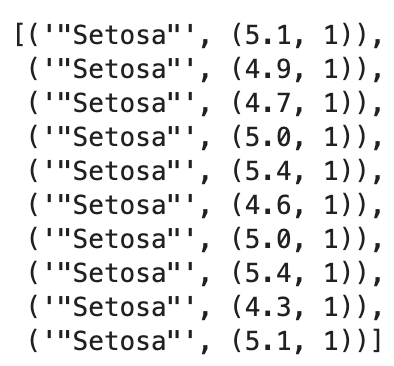
Image 4 - Using the mapValues() function in Spark (image by author)
Now comes the tricky part. The reduce operation will need to sum both sepal length measurements and the counts. To do this, use reduceByKey() method and specify yet another lambda function:
iris_sl_totals = iris_parsed.mapValues(lambda x: (x, 1)).reduceByKey(lambda x, y: (x[0] + y[0], x[1] + y[1]))
iris_sl_totals.collect()
You can see the results summed for both sepal length and the counts:
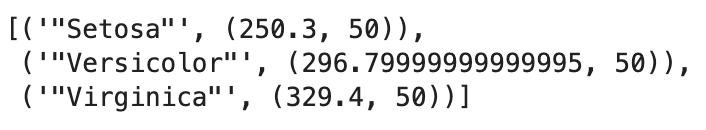
Image 5 - MapReduce results (image by author)
To calculate the means, simply call mapValues() once again and divide the total sepal length by the count. I’ve also rounded the result to two decimal points:
iris_sl_means = iris_sl_totals.mapValues(lambda x: round(x[0] / x[1], 2))
result = iris_sl_means.collect()
result

Image 6 - Sepal length means per species (image by author)
You can access this result object to pretty-print the values:
for val in result:
    print(f"Iris species {val[0]} has an average sepal length of {val[1]}")
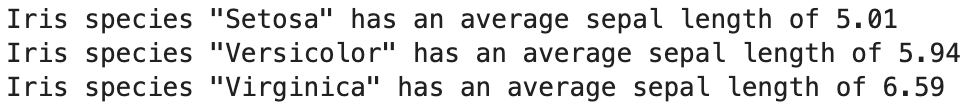
Image 7 - Pretty printed sepal length means per species (image by author)
And that’s your basic MapReduce operation in Spark and Python. Next, we’ll wrap the entire logic into a Python script.
Write and Execute Spark Script
Create a new Python script - I’ve named mine iris_sl_means.py and paste the code from the previous section - without the collect() calls:
from pyspark import SparkConf, SparkContext

conf = SparkConf().setMaster("local").setAppName("IrisSLMeans")
sc = SparkContext(conf=conf)


def parse_input(line: str) -> tuple:
    cols = line.split(",")
    sepal_length = float(cols[0])
    species = str(cols[-1])
    return (species, sepal_length)


if __name__ == "__main__":
    # 1. Read the text file
    iris = sc.textFile("file:///Users/dradecic/Library/Mobile Documents/com~apple~CloudDocs/BDS/Articles/SPARK/002_spark_rdd/iris.csv")

    # 2. Remove the header row
    iris_header = iris.first()
    iris_header = sc.parallelize([iris_header])
    iris = iris.subtract(iris_header)

    # 3. Parse the input
    iris_parsed = iris.map(parse_input)

    # 4. Calculate totals - sum of all sepal_length values per flower species
    iris_sl_totals = iris_parsed.mapValues(lambda x: (x, 1)).reduceByKey(lambda x, y: (x[0] + y[0], x[1] + y[1]))

    # 5. Calculate means - Divide the total by the number of instances
    iris_sl_means = iris_sl_totals.mapValues(lambda x: round(x[0] / x[1], 2))

    # 6. Wrap into a result
    result = iris_sl_means.collect()

    # Print
    for val in result:
        print(f"Iris species {val[0]} has an average sepal length of {val[1]}")
Run the script from the Terminal:
spark-submit iris_sl_means.py
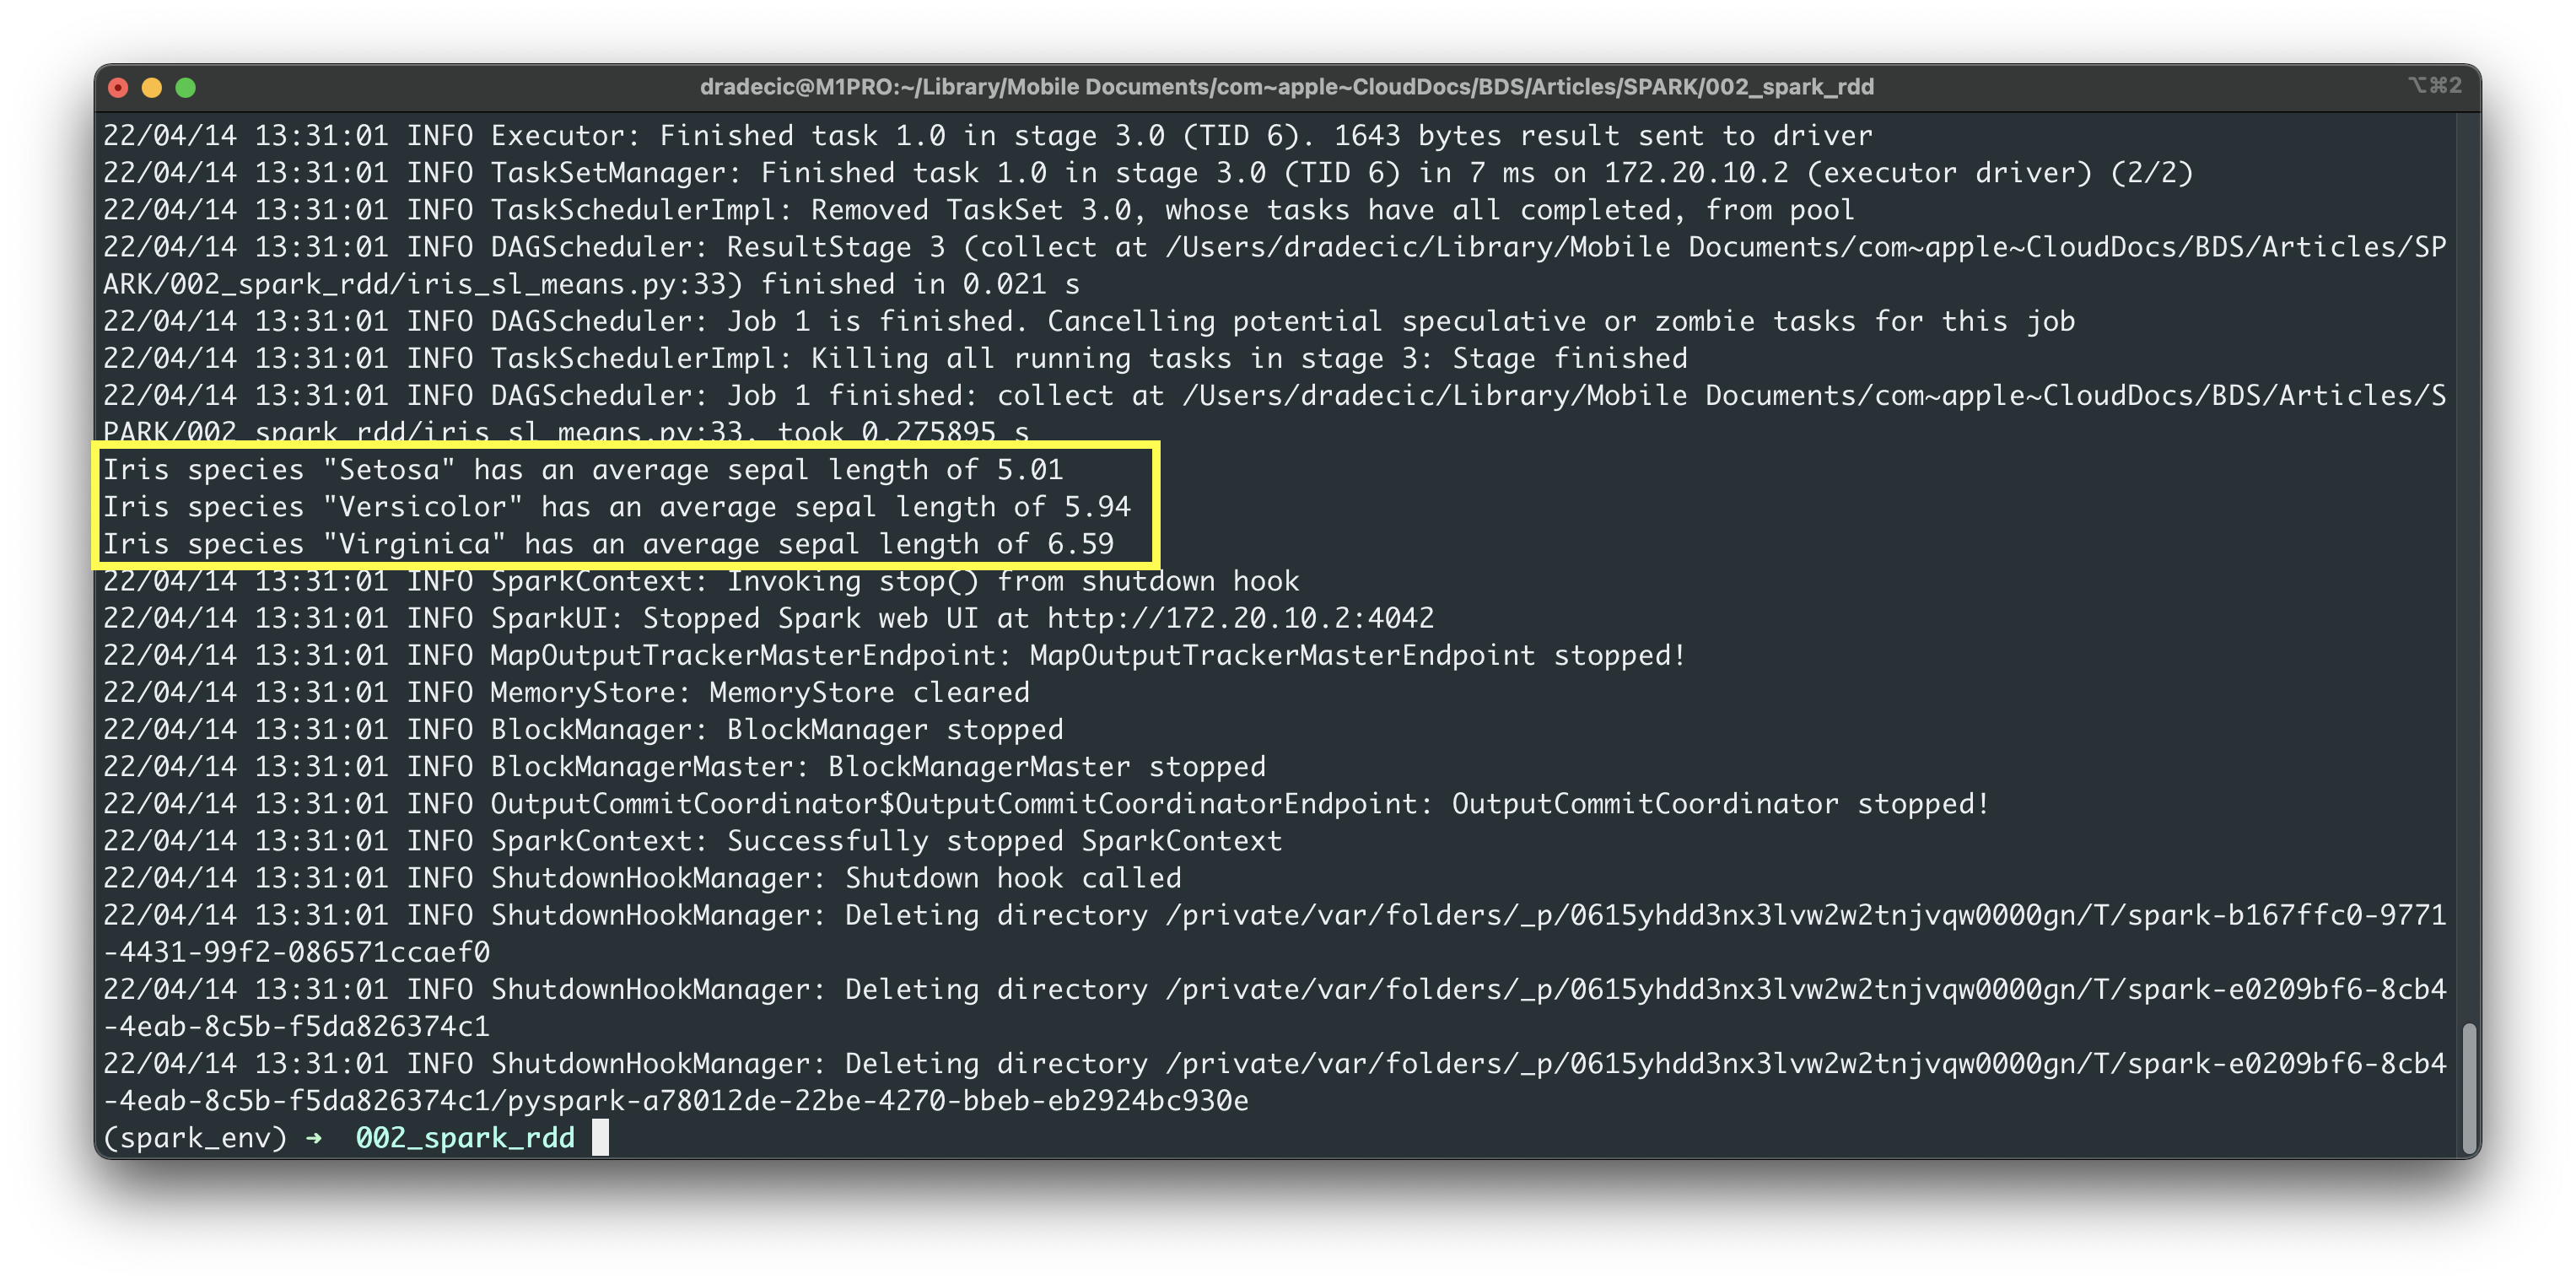
Image 8 - Running Spark scripts from the shell (image by author)
I forgot to configure Spark to now show INFO log messages, so apologies for the unnecessarily detailed output. Nevertheless, you can see the same result as earlier in the notebook.
Summary of Spark RDDs in Python
Today you’ve learned the basics of RDDs in Spark and Python. RDDs aren’t a concept you can learn in a day. There’s much theory behind them, and the syntax can be overwhelming if you’re not used to seeing so many lambda functions on a single line.
Luckily, you can play around with RDDs in a notebook and call collect() whenever you want. By doing so, you can see what’s going on after each function call. Hopefully, that’ll be enough to wrap your head around the logic.
In the following article, you’ll learn how to solve the classic word count problem in Spark and Python, so stay tuned.
Recommended reads
- 5 Best Books to Learn Data Science Prerequisites (Math, Stats, and Programming)
- Top 5 Books to Learn Data Science in 2022
- 7 Ways to Print a List in Python
Stay connected
- Hire me as a technical writer
- Subscribe on YouTube
- Connect on LinkedIn