Range in R returns a vector that contains the minimum and maximum values of the given argument - known in statistics as a range. You can think of range as an interval between the lowest and the highest value within the vector. A vector can be anything, from a list of numbers to a dataframe column - R really doesn’t care.
Actually, a range is a difference between the maximum and minimum values in a vector, but calculating the range in R reports only the interval extremes. You can subtract one from another to get the actual range.
Today you’ll learn how the range() function in R works with a ton of practical examples. You’ll work with regular and character vectors, dataframes, and dataframe columns, and you’ll also see how to handle missing and infinite values.
Range in R - Definition and Usage
You want to learn how to find values within a range in R? You’re at the right place. In this section, we’ll go over the syntax and return values which will serve as the basis for hands-on examples later.
Syntax
range(x, na.rm = FALSE)
Where:
x- A character or a numeric vector.na.rm- An optional parameter that specifies whether NA values should be removed before calculating the range.
Return value
The range() function in R returns either a double or a character, depending on whether a numeric or character vector was passed as an argument.
Range in R - Examples
We’ll go over six examples in this section and cover the usage from basic numeric vectors to entire dataframes.
How to find the minimum and maximum value with Range in R
The following code shows how to calculate the range of a numeric vector:
arr <- c(-10, -15, 5, 19, 27, 0)
range(arr)
Output:
-15 27
Makes sense as 27 is the highest value while -15 is the smallest.
Using Range function on a character vector
You won’t always work with numerical data. You can calculate the range on strings, and the function will return the first and last values sorted alphabetically:
arr_char <- c("Bob", "Mike", "Kelly", "Sue")
range(arr_char)
Output:
"Bob" "Sue"
Find the Range of a vector with missing (NA) values
Real-world data is often messy and full of missing values. They tend to mess up your calculations if not handled properly. Here’s an example:
arr <- c(-10, -15, NA, 19, 27, 0)
range(arr)
Output:
NA NA
Specify na.rm = TRUE to avoid this issue:
range(arr, na.rm = TRUE)
Output:
-15 27
Find the Range of a vector with infinite (Inf) values
Calculation errors can sometimes result in Inf values, either positive or negative. They mess up the range calculation, as they’re either the smallest or largest value of a vector:
arr <- c(-10, -15, Inf, 19, 27, 0)
range(arr)
Output:
-15 Inf
Specify finite = TRUE to exclude Inf from the range calculation:
range(arr, finite = TRUE)
Output:
-15 27
Using Range function on a DataFrame column
Let’s store the Iris dataset into a variable df:
df <- iris
head(iris)
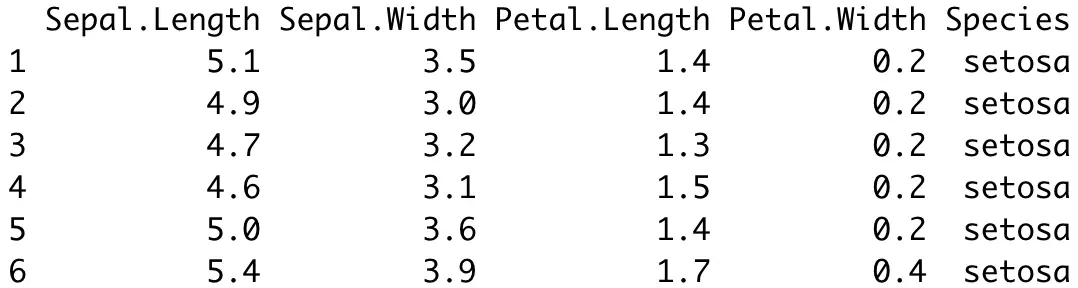
Image 1 - Head of Iris dataset (image by author)
You can calculate the range of a specific dataframe column this way:
range(df$Sepal.Length)
Output:
4.3 7.9
Using Range function on the entire DataFrame
But what if you need the range of the entire dataset? Well, you can only calculate it for numerical columns on this dataset:
df_numeric <- df[c('Sepal.Length', 'Sepal.Width', 'Petal.Length', 'Petal.Width')]
range(df_numeric)
Output:
0.1 7.9
This doesn’t tell you much - you don’t know in which columns the minimum and maximum values are. Use sapply() function to get the range of individual columns:
sapply(df_numeric, function(df_numeric) range(df_numeric))

Image 2 - Calculating range of the entire dataset (image by author)
Conclusion
Today you’ve learned how the range in R works through a ton of practical examples. It’s a simple function understand, but definitely required to have under your toolbelt. You’re now ready to use it in your data analysis projects, as there are no data types or use cases you can’t handle.
Stay tuned for the follow-up articles, as we’ll explore other useful built-in R functions.
Stay connected
- Hire me as a technical writer
- Subscribe on YouTube
- Connect on LinkedIn